National Institute for Basic Biology


Organogenesis is accomplished by a series of deformations of the planar cell sheet into a three-dimensional shape during embryogenesis. This drastic structural change is the integrated result of individual cell behaviors in response to spatio-temporally controlled mechanisms.
To better understand the programs underlying organ formation, it is necessary to quantitatively analyze individual cells’ morphology and dynamics. However, it is difficult to do so due to the massive images generated by 4D microscopy and their ambiguity.
To unveil organogenesis from the point of view of distinct cell behaviors, we are developing application software that is capable of describing cell dynamics from 4D time-lapse imaging data sets by employing image processing techniques.
Epithelial morphogenesis in developing embryos is considered to be an important model for collective cell migrations. Drastic cell rearrangements lead to drastic structural changes in building elaborate organs such as the tubular network of Drosophila trachea. We are developing a software pipeline, which automatically recognizes individual cell shapes out of 3D space and tracks them through time. This system extracts cell boundaries and reconstitutes cell shapes as a skeletonized chain of voxels spanning 3D space. This abstract form of cell visualization makes it possible to describe morphometric quantities and kinetics of cells in single-cell resolution (Figure 1). These morphometric quantities allow us to perform comparative studies on shapes and behaviors more precisely among several experimental conditions to gain a better understanding of the genetic programs underlying organogenesis. We are now applying this system to several experimental models to determine the practicality of the system (Shinoda et al.).
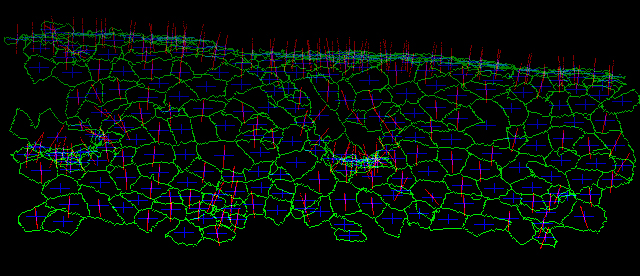
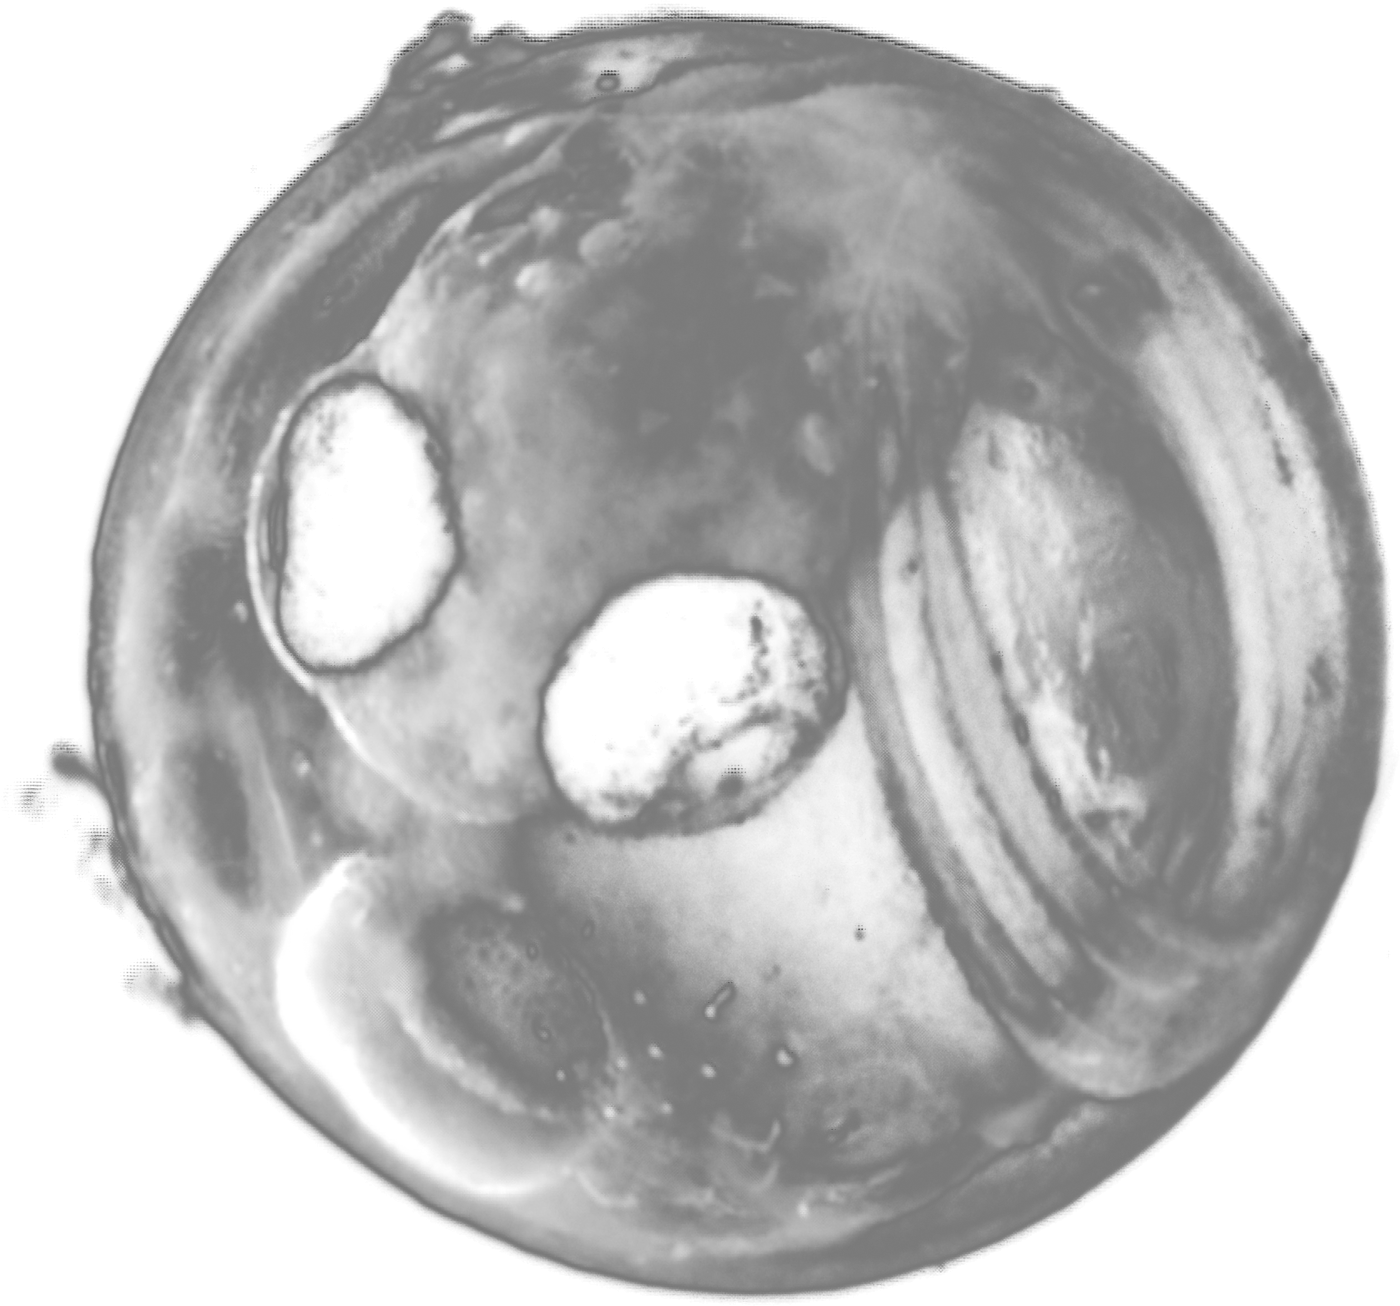
Figure 1. Visualized apical cell surface of Drosophila embryonic epidermal cells. A time-lapse confocal microscopic data set of a fly embryo expressing E-cadherin-GFP was subjected to our automatic cell shape recognition system. Cell boundaries (green), center of gravity (blue) and normal vector (magenta) are indicated for each cell.
To elucidate the relationship between mechanical forces and epithelial deformation, we developed an image processing pipeline for segmentation of nucleus within 3D culture of MDCK cells. This pipeline automated a segmentation/quantification process of a large number of images acquired by several experimental conditions for subsequent statistical analysis (Nishimura et al.).
Biologically significant imaging features are not always significant to computational algorithms due to their structural instability. This kind of difficulty requires human eye inspection for feature extractions. A GUI (Graphical User Interface) application we have developed can easily visualize 4D imaging data and has made manual feature annotations easier (Figure 2). This application is freely available at our website (https://bioimageanalysis.jp/).
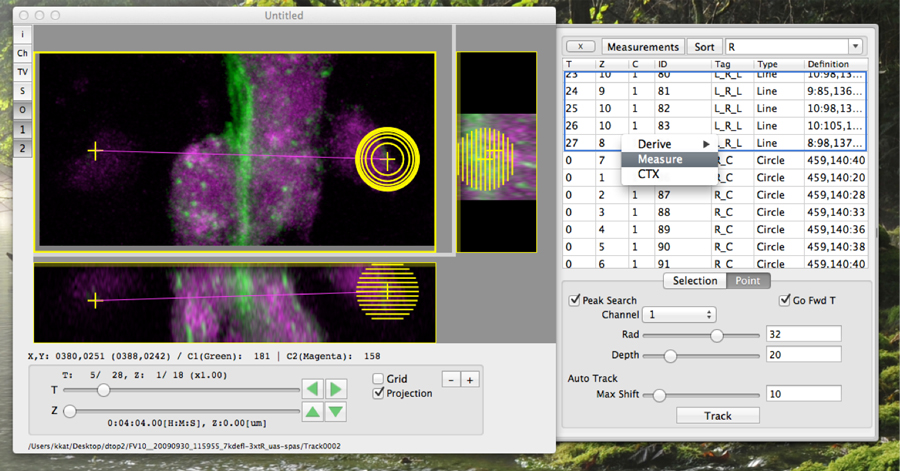
Figure 2. A lightweight/native 4D stack viewer equipped with functions for manual feature extraction.