12.2 Protonema development
Yuji
Hiwatashi and Yoshikatsu Sato
Introduction
This protocol will be useful to analyze protonema development such as
growth, cell division, the number of chloroplast in P. patens.
Marerials: White light grown protonemata in glass-bottom
dish
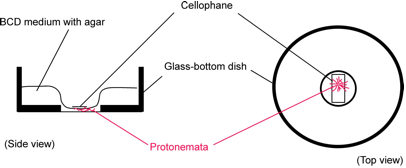
(1) Pre-culture
Overlay BCDATG medium on a 35 mm glass-bottom dish (IWAKI 3910-039: a 27 mm diameter opening in the center of a dish,
Inoculate ~7-day-old protonema tissue on the center region of BCDATG
medium and seal the glass-bottom dish with surgical tape.
Incubate the dish under white light (60 µmolm-2sec-1) at 25˚C for 4~7 days.ü@
(2) Observation
(2-1) Analysis of cell length and width
We measure length and width of a subapical cell or a second subapical
cell.
Capture an image of a subapical cell or a second subapical cell under a
microscope.
Measure length and width of these cells using ImageJ.
(2-2) Analysis of growth velocity and cell division by
time-lapse observation
Time-lapse image acquiring enables us to analyze the growth velocity
and process of cell division as well as cell length and width.
1. Keep room temperature at 25˚C.
2. Place the dish on the stage of an inverted microscope.
3. Seek a protonemal apical cell just before cell division and focus on its nucleus. The apical cell before cell division is much longer than its neighboring subapical cell and its cytoplasm is localized at the apical end. One of the signs of mitosis is a transition of nuclear shape. Just before entering prophase, a nucleus becomes spherical rather than oval.
4. Carry out time-lapse observation. M-phase ends within ~40 min in
this condition, so take an image at every 60 sec. Excitation light intensity
should be weak as far as possible especially when GFP signals are observed.
Strong light inhibits cell division and fades GFP fluorescence.
(2-3) The numbers of chloroplasts
The procedure for counting the numbers of chloroplasts was described in
the previous paper (Hayashida et al. 2005). The numbers of chloroplasts in
subapical cells of chloronemata can be counted under a light microscope.
Average numbers in a chloronema cell of wild type are about 50.
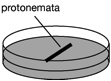
Marerials: Protonemata grown under unilateral red
light
Protonemata grown under unilateral red light were used for analyses of
chloroplast movement (Kadota et al. 2000). The resultant filaments are also tractable
system for analyses of protonema development for the following reason. Firstly,
many protonemata are generated and phototoropic growth towards red light
aligned resultant filaments parallel each other, facilitating us to search
target cells. Secondly, protonemata grow uniformly without branches, enabling
us to collect populations easily. Thirdly, side branch initiation is induced by
the subsequent white light irradiation, allowing us to analyze the stem cell
formation such as study of the cell cycle re-entry.
(1) Pre-culture
1. Protonemal cells are sub-cultureed on cellophane-overlaid BCDAT
plates under continuous white light (30-60 µmol m-2 sec-1) at 25˚C
every 5~7 days.
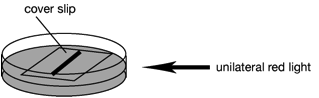
2. Small amount of 5~7-day-old protonema cells are inoculated on BCDAT
plates (35 mm-diameter dish) and covered with a sterile cover slip (18 x18 mm).
3. The protonema tissues are cultured under unilateral red light (3~5
µmol m-2 sec-1) at 25˚C for 7 days.ü@
Red light can be obtained from fluorescent tube filtered through a red
plastic sheet (We use shikolite 102; Mitsubishi Rayon, Japan,
http://www.mrc.co.jp/shinkolite/index.html)
(2) Observation
(2-1) Protonema growth
1. Capture images of
overall protonemal filaments using a stereomicroscope.
2. Compare the
length from inoculated cells to apical cells of protonemal filaments.
Apical protonema growth shows a typical tip growth, and a daughter cell
divided from the apical cell does not growth. Therefore, the difference of the
protonema filament length only depends on the rate of tip growth. We can detect
easily the growth defect.
(2-2) Cell length and width
We measure length and width of a subapical cell or a second subapical
cell.
Capture an image of a subapical cell or a second subapical cell under a
microscope.
Measure length and width of these cells using ImageJ.
(2-3) Analysis of cell division by time-lapse observation
For this purpose, time-lapse observation is performed.
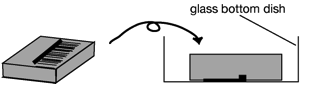
1. Remove a cover slip from the plate and cut an agar block containing
protonema cell from the solid medium with a scalpel. Turn the block up-side
down and place it into 35 mm glass-bottom dish (IWAKI 3910-039: a 27 mm diameter opening in the center of a dish, http://www.atgc.co.jp/div/rika/hbine/index_e.html)
as protonema cell are touched on the bottom of the dish.ü@ Seal the dish with parafilm.
2. Place the dish on a stage of an inverted microscope. While you
observe, room temperature should be set at 25˚C.
3. Seek protonemal apical cell just before cell division and focus a
nucleus. An apical cell before division is highly elongated and its cytoplasm
is localized to apical side of a cell. One of the signs of mitosis is
transition of a nuclear shape. Just before entering prophase, a nucleus will be
a spherical shape rather than an oval shape.
3. Start the time-lapse image acquiring. M-phase will finish ~40 min in
this condition. We usually acquire an image every 60 sec. If you examine the
dynamics of GFP-fusion protein, you should not irradiate strong excitation
light to the cell for preventing from not only fluorescence fading but also damaging
cellular function.
(2-4) The numbers of chloroplasts
When you count the numbers of chloroplasts in a white light grown cell
under a light microscope, crossover of chloroplasts often makes you difficult
to numerate them accurately. One solution is counting them from the LSM
Z-sectioning images. However, another soft solution is counting them in a red
light grown cell. Cell length of red light grown protonema (about 120 µm)
is longer than that of white light grown one (about 80 µm) and the size
of chloroplasts in red light grown cell is smaller than that in white light
grown one, posses, facilitating us to count the numbers of chloroplasts.
(2-5) Quantitative analysis from time-lapse data

 Time-lapse data tells us dynamic properties of
cells. Here, we will introduce a representative method for quantitative
analysis from time-lapse data. The method is üekymographüf. Kymograph shows a
time space plot
Time-lapse data tells us dynamic properties of
cells. Here, we will introduce a representative method for quantitative
analysis from time-lapse data. The method is üekymographüf. Kymograph shows a
time space plot
The left image is the original kymograph data of protonemal growth. We
can get the following properties of the protonema cell from one time-lapse
experiment.
1) Changes of growth
velocity
2) Nuclear behaviors
3) Chloroplast
behaviors
4) Cell cycle period
5) Cell length
We usually use Metamorph software at
http://www.moleculardevices.com for kymograph
analysis. You can do kymograph analysis using freeware, Kymograph Plugin for
ImageJ at http://www.embl.de/eamnet/html/body_kymograph.html.
Reference
1) Kadota A, Sato Y, Wada, M. (2000) Planta
210, 932-937
2) Hayashida et al. (2005) Plant Biology 7, 300-306