| RESEARCH CENTER FOR INTEGRATIVE AND COMPUTATIONAL BIOLOGY |
||||||||||||
|
||||||||||||
| The neutral theory of molecular evolution, the basic theory
for explaining evolutionary changes at the molecular level, claims
that most evolutionary changes at the molecular level are caused by
random drift of neutral mutants. This is sharply contrasted to the
evolution at the organismal level, where it is generally thought that
natural selection is the major driving force by which evolutionary
changes occur. How can we explain the evolutionary changes at the
two levels in a unified way. This is the major problem that remains
unsolved for molecular evolutionists. As a first step for understanding
the final problem, we are investigating relationships of evolutionary
diversifications between molecular and organismal levels, based on
molecular phylogenetic approach. In multicellular animals, a variety of gene families involved in cell-cell communication and developmental control have evolved through gene duplication and gene shuffling, basic mechanisms for generating diverse genes with novel functions. Each of these animal gene families is thought to have originated either from a few ancestral genes which are shared with plants and fungi or from an ancestral gene created uniquely in animal lineage. The major groups of bilateral animals are thought to have diverged explo-sively at or prior to the Vendian - Cambrian boundary. No direct molecular evidence has been provided to date as to whether the Cambrian explosion was triggered by a dramatical increase in the number of genes involved in cell-cell commu-nication and developmental control either immediately prior to or in concert with the Cambrian explosion. A molecular phylogeny-based analysis of several animal-specific gene families has revealed that the gene diversification by gene duplication occurred during two active periods interrupted by a long intervening quiescent period. Intriguingly, the Cambrian explosion is situated in the silent period, indicating that there is no direct link between the first burst of gene diversification and the Cambrian explosion itself. The above result also suggests the importance of gene recruitment as a possible molecular mechanism for morphological diversity. To understand a possible origin of animal-specific gene families,
we have carried out cloning and sequencing of genes related to the
animal-specific protein tyrosine kinase (PTK) genes from choanoflagellates,
a group of unicellular plotists known to be the closest relatives
of multicellular animals. Many PTK related genes including both the
receptor and non-receptor type genes have been identified, some of
which are likely to be orthologous to animal PTKs. A molecular phylogenetic
tree of the PTK family members including those from animals and choanoflagellates
showed an unexpected pattern of the PTK gene family: Most gene duplications
that gave rise to different PTK subfamilies recognized in all animal
groups occurred at very ancient times before the divergence of animals
and choanoflagellates. The phylogenetic relationships among tetrapods and two living groups
of lobe-finned fishes, the coelacanth and the lungfishes are still
unsolved and debated, despite many studies based on morphological
and molecular data. Recent analyses based on complete mitochondrial
sequences resulted in confusing phylogenetic trees, which are obviously
inconsistent with generally accepted trees. To resolve this difficult
phylogenetic question at statistically solid bases, we have cloned
and sequenced ten nuclear DNA-coded genes from fourteen major groups
of vertebrates, including the coelacanth and the three lungfish species.
These sequences, together with sequences available from databases,
have been subjected to phylogenetic analyses based on the maximum
likelihood (ML) method, using a cyclostome and a lancelet as an outgroup.
The obtained ML tree supports the close association of the coelacanth
and the lungfish, suggesting that the coelacanth and the lungfish
equally closely related as sister groups of tetrapods. |
||||||||||||
|
||||||||||||
|
We are studying biological phenomena of higher orders by using mathematical
models. Mathematical models give us integrative understanding for
complex behavior of biological systems including a lot of factors.
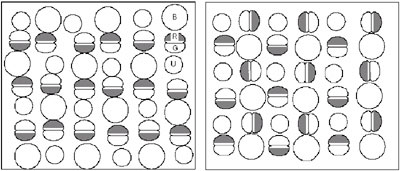
In teleost fish, there are several subtypes of cone cells, which are sensitive to different wave-lengths of light. In retinas of some species of teleost fish, regular arrangements of cone cells are observed, where each subtype of cone cells appears periodically in the two-dimensional retinal sheet. These patterns are called "cone mosaics." The biological mechanism of the pattern formation is still under examination. Some species show quite different mosaic patterns between peripheral region and more central region in the retina, which suggests mobility of cone cells in retinal space. Different patterns are observed in different species. For example,
in the zebrafish retina, there are four subtypes of cones, maximally
sensitive to blue, red, green and ultra-violet. A green-sensitive
cone cell and a red-sensitive cone cell are in tight contact and form
a double cone. The cells of the other two subtypes are called single
cones. The blue-, ultra violet-, red-, and green-sensitive cones are
also called long single, short single, long double, and short double
cones, respectively. In an adult zebrafish retina, rows of single
cones and those of double cones appear alternatively. This pattern
is called a “row mosaic”.
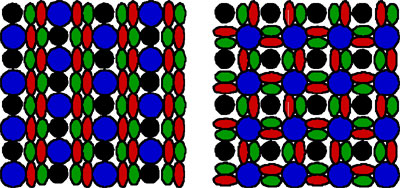
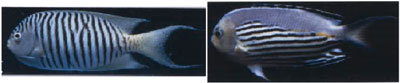
In contrast, in the medaka retina, four types of cones are arranged in a different manner as illustrated in Fig. 1. In the medaka pattern, each blue-sensitive cone is surrounded by four double cones, and the red-sensitive part of a double cone is close to the green-sensitive part of another. This is called a “square mosaic”. We have studied the mechanism of the pattern formation by using mathematical
models. In this study, we examined a process of cell-cell interaction
to generate the regular mosaic pattern -- namely cell rearrangement.
In the model, cells have already been determined as to their final
subtypes, but they change their locations in the pattern formation
process and the cell movement is affected by their neighbours.
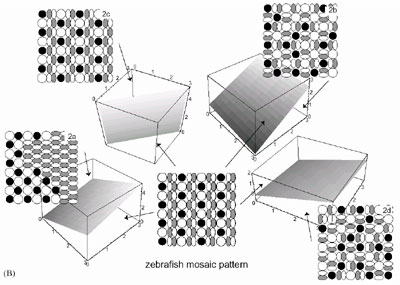
We show that the same model can produce both row and square mosaic
pattern. If the cell-cell interaction is restricted to nearest neighbors
only, the square mosaic pattern cannot be generated. We studied the
model considering the adhesion working between nearest neighbors and
next nearest neighbors, with different weighting between them. Two “shape factors” specifying how to combine adhesion in
different geometric are very important in determining whether row
mosaic (zebrafish pattern) or square mosaic (medaka pattern) is to
be formed.
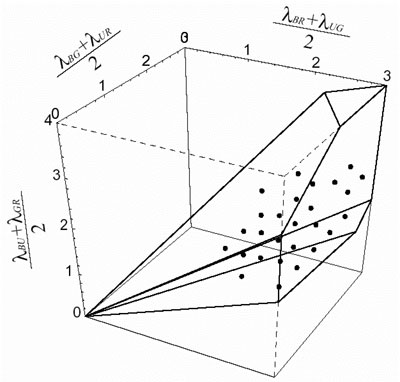
We study the conditions for generating mosaic pattern. The condition
for generating zebrafish mosaic are shown in Fig. 3, 4. They are the
necessary condition and that should be satisfied even in actual organisms
if they make the arrangement based on cell adhesion and cell movement.
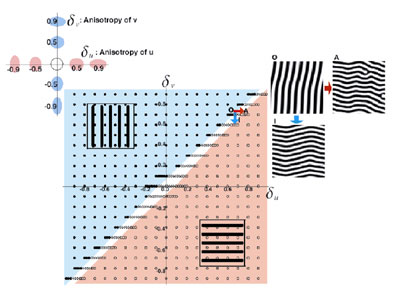
The pattern formation of animal coating has been studied mathematically by a pair of partial differential equations, named a reaction-diffusion (RD) model. By the model, starting from an initial distribution very close to uniformity, a spatial heterogeneity emerges and a stable periodic pattern is formed spontaneously. This simple mechanism suggests that the reaction of a small number of chemicals and their diffusion might create stable non-uniform patterns. When we analyze the model in a two dimensional plane, striped patterns in addition to spotted patterns often emerge. This was considered as the basic mechanism explaining the stripe patterns observed among animal coating. We focused on the directionality of the stripes. Most of the stripes observed in the fish skins are either parallel or perpendicular to their anterior-posterior (AP) axis. The direction of stripes is considered of importance in the behavioral and ecological viewpoints. However, very little is known about the mechanisms that makes the strong directionality either in the actual fish skin or in the theoretical models. The standard RD model doesn't determine the direction of stripes. To explain the directionality of stripes on fish skin in closely related species, we have studied the effect of anisotropic diffusion of the two substances on the direction of stripes, in the cases in which both substances have the high diffusivity in the same direction. We also studied the direction of stripes in more general situations
in which the diffusive direction may differ between the two substances.
We derived a formula for the direction of stripes, based on a heuristic
argument of unstable modes of deviation from the uniform steady state.
We confirm the accuracy of the formula by computer simulations. When
the diffusive direction is different between two substances, the directions
of stripes in the spatial pattern change smoothly with the magnitude
of anisotropy of two substances. When the diffusive direction of the
two substances is the same, the stripes are formed either parallel
to or perpendicular to the common diffusive direction, depending on
the relative magnitude of the anisotropy. The transition between these
two phases occurs sharply.
Publication List: Tohya, S., Mochizuki, A. and Iwasa, Y. (2003) Random cell sorting can form cone mosaic patterns in fish retina and explain the difference between zebrafish and medaka. J. Theor. Biol. 221, 289-300. Shoji, H., Mochizuki, A., Iwasa, Y., Hirata, M., Watanabe, T., Hioki, S. & Kondo, S. (2003) Origine of directionality in the fish stripe pattern. Dev. Dyn. 226, 627-633. Ryohji, T., Mochizuki, A. & Iwasa, Y. (2003) Possibility of Tissue Separation Caused by Cell Adhesion. J. Theor. Biol. 221, 459-474. |
||||||||||||